QFD - Quality Function Deployment
A bit like the Kano model, we've nicked it from the 20th century Japanese manufacturing industry and repurposed it for digital products.
To summarise, QFD is basically a practice where you brainstorm a list of feature/task ideas, interview the customers about what they think is important, refine that list of features based on the customer feedback, identify how important the tasks are with what the customer wants and the rank the tasks by relevant importance.
This is a simple implementation of QFD. You can get more complex and sophisticated with it, but this will typically make the process take longer, which could potentially be worth it depending on the project.
Step 1: Identify customers' wants and needs
- Come up with as many ideas as you can for features, functions and user tasks. You can brainstorm internally, interview customers, analyse competition or any other ways you come up with ideas.
Step 2: Identify the voice of the customer
- Interview the customer with your list of ideas and ask them to pick the most important ones.
- Bear in mind that usually a customer will think they are all important. The quickest and fastest way to get a ranking is to use a top tasks analysis. If you have a list of 100 then get them to pick 5. If you have a list of 30-40 then just get them to pick 3.
- By analysing enough of these results you will tend to find a pareto distribution in the results
Step 3: Identify the "voice of the company"
- Create a list of features based on the results. Either take from your initial list that you brainstormed or use new ideas that you discovered from the customer feedback
Step 4: Relationship between the "voice of the customer" and "voice of the company"
- This is basically thinking about how relevant what you are going to do is with how you are going to do it#
- Using this method, we use a ranking system in a table to understand how strong the relationship is between the "how" and the "what". 9 means a direct and strong relationship, 3 means a moderate relationship, 1 is a weak relationship and blank means no relationship
- Below is an example of what it could look like
- The weight is the percentage of customers who selected it as important
- You multiply the rank with the weight, then add each row within that column together to get the raw score. Once you have all of the raw scores you get the relative rank of importance
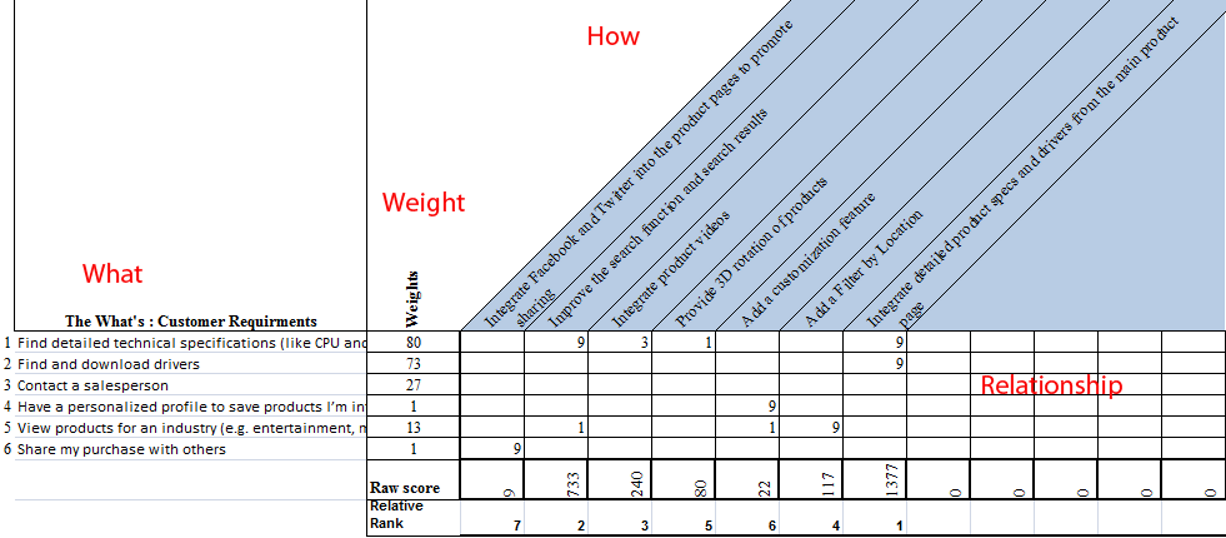
Step 5: Generate Priorities
- The higher numbers represent less of an impact than the relative ranking
Step 6: Examine Priorities
- In the above example, the two highest rank are well above the other 5
- A blank row would mean that the customer want is not supported