Victory Chart Guide: How to draw a trend line in Victory
Victory is a very helpful library to easily build charts and data visualisations in React. You can read more about it and find their documentation here https://formidable.com/open-source/victory/docs
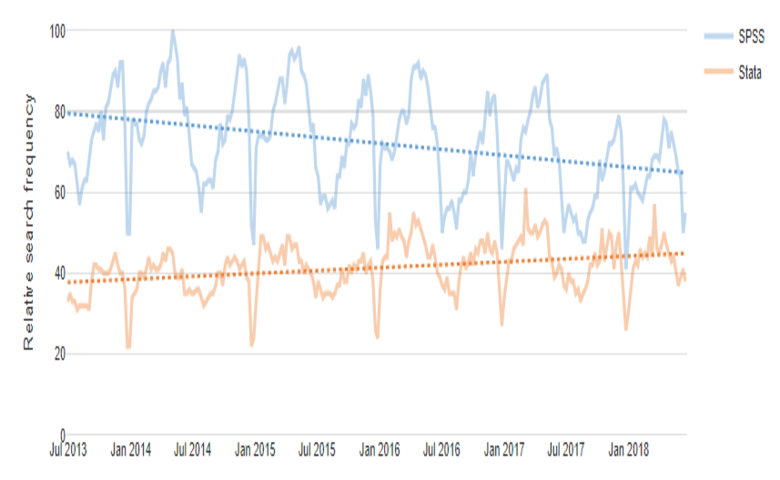
Though it was very simple and straight forward to draw a simple line chart - We also had a requirement to draw a trend line to show how the data is going up or down over time without any of the spikes. Below I've included a generic example of a chart using trend lines. The trend lines are the dotted lines.
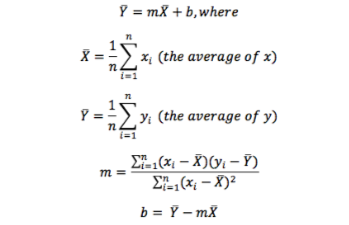
Though when tasked with creating the trend line using this library, it was difficult to prepare the data on my own as it required mathematical equations that looked like gibberish to me.
So we found a trend line library that does these calculations for me. The problem we then ran into was it didn't work. Great, what now? We realised when viewing the source it was only one file with three methods, so we changed some of the code to make it work (basically editing the format of one of the dates, you can see from the code below).
If you combine the below code with the Example use with Recharts from the library's documentation, you can get the trend line data you feed to Victory to make it work.
// This function copied from the trendline npm package
    function getAvg(arr) {
      const total = arr.reduce((acc, c) => acc + c, 0);
      return total / arr.length;
    }

    // This function copied from the trendline npm package
    function getSum(arr) {
      return arr.reduce((acc, c) => acc + c, 0);
    }

    // This function copied from the trendline npm package
    function createTrend(data) {
      // changed this line below to convert the date into a timestamp
      const xData = data.map((value) => value["x"].getTime());
      const yData = data.map((value) => value["y"]);

      const xMean = getAvg(xData);
      const yMean = getAvg(yData);
      const xMinusxMean = xData.map((val) => val - xMean);
      const yMinusyMean = yData.map((val) => val - yMean);
      const xMinusxMeanSq = xMinusxMean.map((val) => Math.pow(val, 2));
      const xy = [];
      for (let x = 0; x < data.length; x++) {
        xy.push(xMinusxMean[x] * yMinusyMean[x]);
      }
      const xySum = getSum(xy);
      const b1 = xySum / getSum(xMinusxMeanSq);
      const b0 = yMean - b1 * xMean;
      return {
        slope: b1,
        yStart: b0,
        calcY: (x) => b0 + b1 * x,
      };
    }
Feed the resulting data into a VictoryLine and you have a trend line! I hope this helps someone in future.